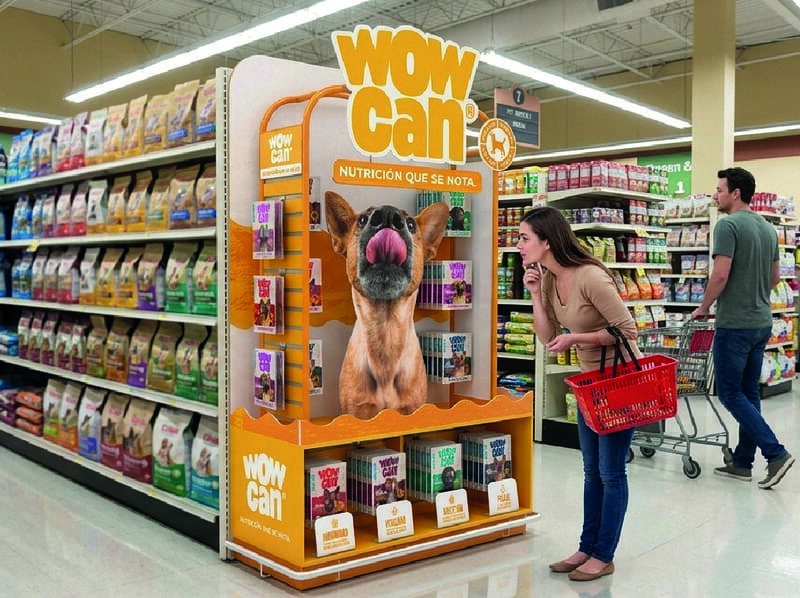
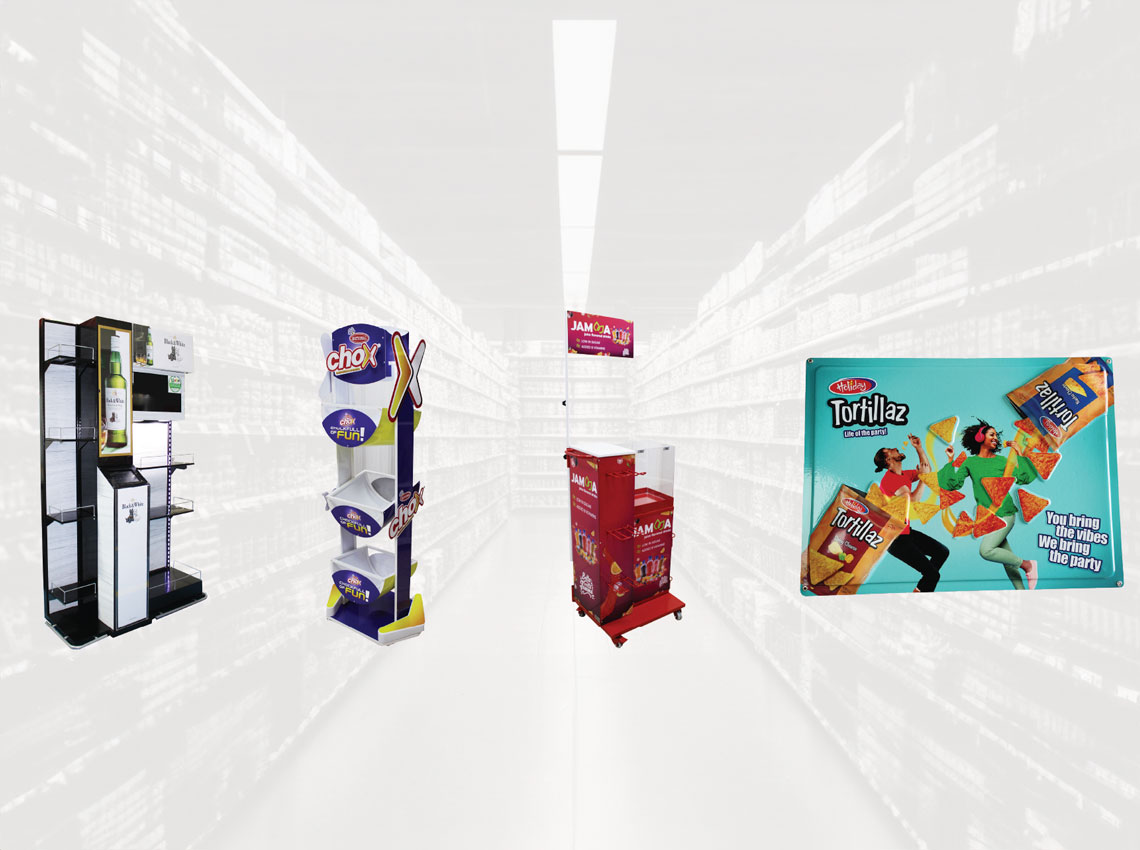
KPIs for retail stores are essential metrics used to measure performance, profitability, and customer experience, such as sales revenue, conversion rate, inventory turnover, and foot traffic. Tracking these indicators helps retailers make data-driven decisions, optimize store layouts and displays, and drive sustainable business growth.
Retail KPIs are the metrics that show how well a store turns traffic into revenue: sales revenue, conversion rate, sales per square foot, average transaction value, inventory turnover and foot traffic. Tracking these retail key performance indicators tells you exactly where sales are being lost, and whether your in store displays are helping or getting in the way.
Most retail teams do not have a data problem. They have a focus problem. Dashboards are full of retail store metrics, but only a handful of them actually change a decision on Monday morning. The rest become reporting noise, and the numbers that would explain what is happening at shelf level, such as how your floor displays are performing store by store, rarely make it into the report at all.
This guide breaks down the 12 retail KPI examples worth tracking, how to calculate each one, and how in store displays influence the numbers that matter most at the exact point where the purchase decision is made.
Retail metrics vs retail KPIs: the difference that changes decisions
Every KPI is a metric, but not every metric deserves to be a KPI. Retail metrics describe what happened in the store. Retail store KPIs are the small group of metrics tied to a business objective, with a target, a review rhythm and an owner attached.
A practical filter you can apply this week: if the number moves and nobody changes anything, it is a metric. If the number moves and someone has to act, it is a KPI.
That distinction matters because retail teams are measured on execution, not on data volume. The goal is not to know more. It is to react faster.
The 12 retail store metrics worth tracking
1. Sales revenue
Total income generated from goods and services sold in a given period. Track it globally, then break it down by category, department and store cluster. Aggregate revenue hides the two things you actually need to see: which categories are pulling weight and which stores are underperforming against comparable locations.
2. Foot traffic
The number of people entering the store, measured with people counters, video analytics or POS correlation. Foot traffic separates a marketing problem from an execution problem. If traffic is stable and sales fall, the issue is inside the store, not outside it.
Counting people is the easy part. The useful part is what happens next: where shoppers slow down, which zones they skip, and how long they stay in front of a category. These in-store metrics turn a traffic number into a merchandising decision.

Custom Retail Display Manufacturers
Ready to boost in-store impact?
Let’s design a customized POP display that makes shoppers stop, look, and buy. From concept to production, we bring your brand to life at the point of sale.
Tell us your product, retail channel, and campaign timeline — we’ll recommend the best display format.
What you’ll get
- Display concept aligned with your brand
- Material & structure recommendations
- Production-ready plan and timeline
3. Conversion rate
Transactions divided by total visitors, multiplied by 100. This is the most revealing of all retail performance metrics, because it isolates execution from traffic.
A conversion rate that drops while traffic holds usually points to something physical: blocked sightlines, confusing adjacencies, out of stock facings or point of sale material that no longer matches the campaign running in media.
4. Sales per square foot
Total sales revenue divided by total selling area. It measures how hard your space is working.
Compare your own stores against each other before comparing against market benchmarks, since category, format and location distort external comparisons. When this ratio underperforms, the cause is often placement rather than assortment. Secondary placements and well positioned floor units recover value from zones that were generating traffic but no sales.
5. Average transaction value
Total revenue divided by number of transactions. Raising ATV grows revenue without spending a single additional dollar on driving traffic.
Cross selling, bundling and complementary product adjacencies are the levers here. A display that places a complementary item within reach of a high rotation product does more for ATV than most promotional discounts.
6. Units per transaction
Total units sold divided by number of transactions. It works as a companion to ATV and tells you whether basket growth comes from more items or simply from higher prices. Only one of those two is sustainable.
7. Inventory turnover
Cost of goods sold divided by average inventory value. High turnover signals healthy demand and disciplined stock management. Low turnover ties up capital in products that are not moving.
Turnover is also a merchandising signal. Slow rotation in a well stocked category is usually a visibility problem before it is a demand problem.
8. Shrinkage rate
Value of lost inventory divided by total sales, multiplied by 100. Theft, damage and administrative error erode margin quietly. Well designed fixtures and controlled display formats reduce accidental damage and improve stock accuracy at shelf.
9. Customer satisfaction
Measured through surveys, reviews and post purchase feedback. Satisfaction is a lagging indicator, but it predicts repeat visits better than almost anything else you track. Clear navigation, legible signage and orderly presentation influence it directly.
10. Employee productivity
Sales revenue divided by number of employees or by labor hours worked. Productivity rises when staff spend less time explaining what is where and more time closing sales. Self explanatory displays effectively act as a silent member of the sales team.
11. Return rate
Returned units divided by units sold. Consistently high returns in a specific category often trace back to a mismatch between what the display communicated and what the shopper actually bought.
12. Basket penetration by category
The percentage of transactions that include a given category. This is the metric brand managers care about most, because it shows whether your product is entering the basket or losing the moment of decision to a competitor standing closer to the shopper.

LA BOULANGERE FLOOR DISPLAY
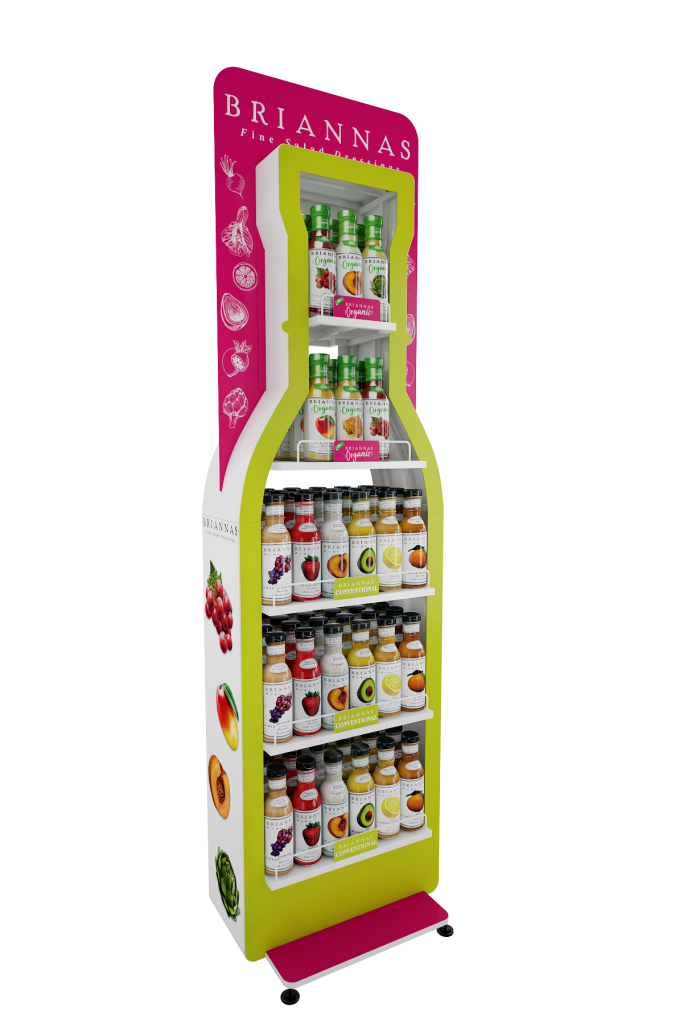
BRIANNAS FLOOR DISPLAY
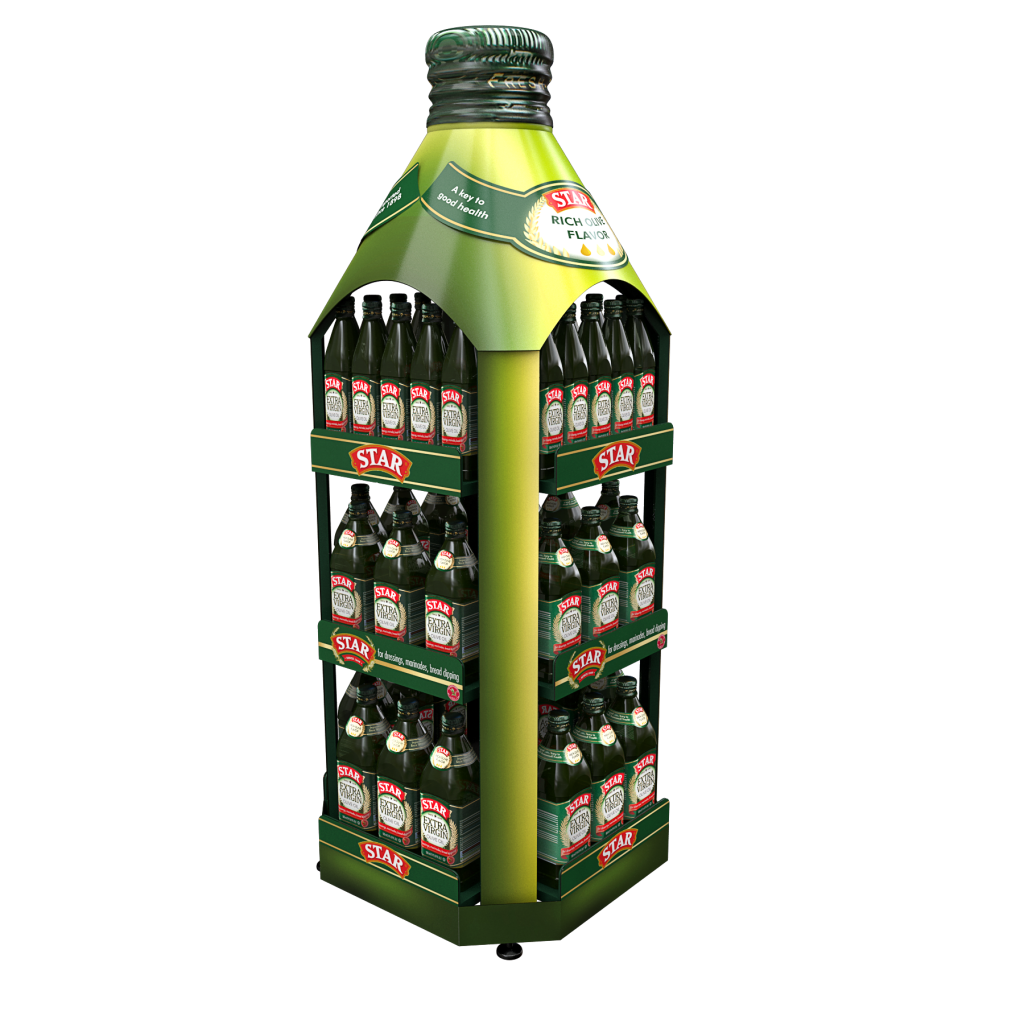
BORGES FLOOR DISPLAY
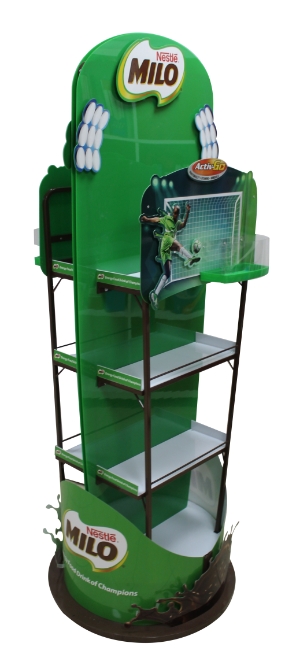
Milo Floor Display

Fernleaf DUMP BIN DISPLAY
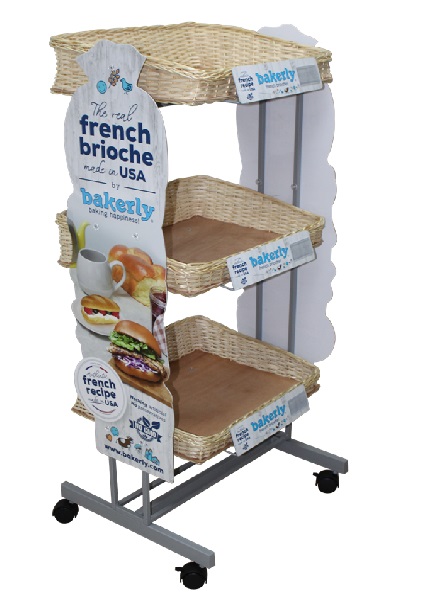
French Brioche Floor Display
Retail display KPIs: the in-store metrics most brands never measure
Here is a gap we see constantly after more than 20 years developing point of sale solutions for FMCG brands in international markets: companies invest heavily in displays and then measure only total category sales. That tells you almost nothing about whether the display worked.

If you activate at point of sale, these retail display KPIs belong in your reporting.
Display compliance rate. The percentage of stores where the display was installed correctly, in the agreed location, on the agreed date. A brilliant concept executed in 40 percent of stores is a 40 percent campaign. Compliance explains most disappointing activations.
Sell out per display unit. Units sold per display per week. This is what lets you compare a floor display against an end cap against a counter unit, and decide where to invest in the next cycle.
Incremental lift. The sales difference between stores with the display and a matched control group without it. Without a control group, you are measuring seasonality and calling it performance.
Share of shelf and share of visibility. How much category space and shopper attention your brand holds versus competitors. Visibility is a leading indicator: it moves before sales do.
Cost per incremental unit sold. Total display investment divided by incremental units. This is the number that turns a merchandising conversation into a finance conversation, and the one that gets budgets approved.
Dwell time at the display. How long shoppers stay engaged with your material. Short dwell time usually points to a message problem, not a placement problem.
How to turn retail metrics examples into weekly decisions
Pick five KPIs, not twenty. One traffic metric, one conversion metric, one value metric, one inventory metric and one display metric.
Set a baseline before you change anything. Most retail store performance metrics only become meaningful when compared against your own history.
Assign an owner to each number. A KPI without a name next to it will not improve.
Review on a fixed rhythm. Weekly for conversion rate and display compliance. Monthly for turnover, productivity and sales per square foot.
Close the loop at store level. When a metric moves, someone should be able to walk the floor and see why.
Frequently asked questions about retail KPIs
What are the most important KPIs for retail stores?
Conversion rate, sales per square foot, average transaction value, inventory turnover and foot traffic. Together they explain how many shoppers arrive, how many buy, how much they spend and how efficiently your space and stock are working.
How often should you review retail store metrics?
Weekly for operational indicators such as conversion rate and display compliance. Monthly for structural ones such as inventory turnover and sales per square foot.
How do displays affect retail performance metrics?
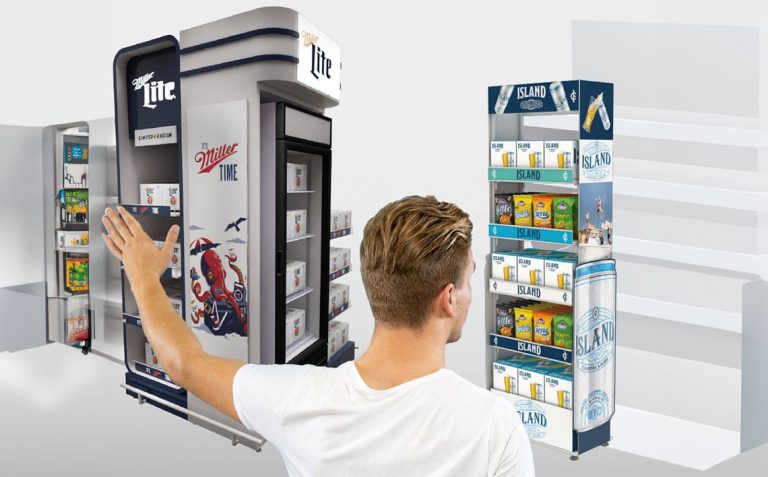
Well designed point of sale displays improve conversion rate, average transaction value and sales per square foot by increasing visibility, accessibility and clarity at the exact moment of decision.
Turning numbers into in-store results
Strong retail performance is rarely about tracking more data. It is about tracking the right retail metrics and acting on them fast enough to matter.
Sales revenue tells you what happened. Conversion rate tells you how well you executed. Retail display KPIs tell you why. When you connect the three, you stop reporting results and start engineering them.If your numbers look solid but your brand keeps losing ground at shelf level, the answer is usually waiting at the point of sale, where a well designed display stops being decoration and becomes a performance asset.